


February 17th, 2021

U.S. Leather and Hide Industry 2021 Year End Review; 2022 Projections
The U.S. hides and skins market recovered in 2021 from previous market lows in 2019 and 2020, as export values across all categories increased significantly. Bovine salted hide exports continued their upward trajectory, rising 64 percent in value last year, while wet blue and pigskin exports reversed their steep declines from the previous year, increasing 53 and 31 percent in value, respectively. Steer hide values, for instance, rebounded in 2021, after falling to their lowest recorded levels in May 2020. The impact of the COVID-19 global pandemic, which injected unprecedented uncertainty into the U.S. cattle, beef, and animal by-products markets over the last two years, has abated, though the global leather industry continues to contend with weaker demand and escalating product substitution.
Meanwhile, U.S. cattle slaughter is expected to decline slightly in 2022, after increasing three percent in 2021. Despite reduced slaughter numbers, the U.S. should maintain an ample supply of hides to the market, with more than 90 percent destined for use in global leather production. The U.S. industry will closely monitor the influence of macro-level factors, including persistent transportation and supply chain challenges, trade policies of the U.S. Administration, and ongoing disruptions related to the COVID-19 pandemic, on its ability to grow and compete in the year ahead.
Cattle Inventory
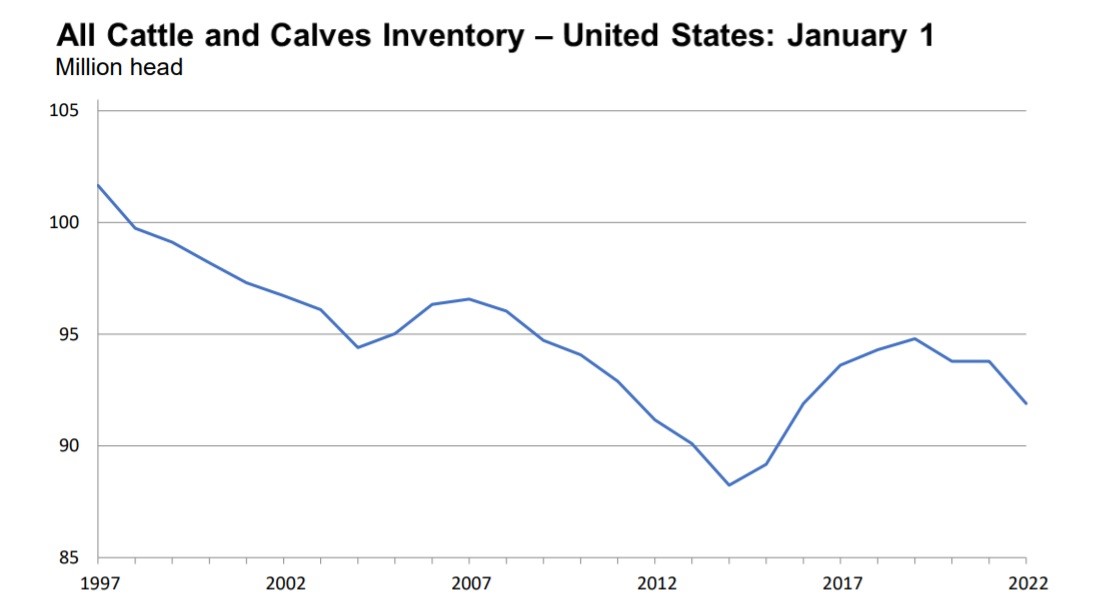
All cattle and calves in the United States as of January 1, 2022 totaled 91.9 million head, 2 percent below the 93.8 million head on January 1, 2021.
All cows and heifers that have calved, at 39.5 million head, were 2 percent below the 40.3 million head on January 1, 2021. Beef cows, at 30.1 million head, were down 2 percent from a year ago. Milk cows, at 9.38 million head, were down 1 percent from the previous year.
All heifers 500 pounds and over as of January 1, 2022 totaled 19.8 million head, 2 percent below the 20.2 million head on January 1, 2021. Beef replacement heifers, at 5.61 million head, were down 3 percent from a year ago. Milk replacement heifers, at 4.45 million head, were down 3 percent from the previous year. Other heifers, at 9.71 million head, were 1 percent below a year earlier.
Steers weighing 500 pounds and over as of January 1, 2022 totaled 16.6 million head, down 1 percent from January 1, 2021.
Bulls weighing 500 pounds and over as of January 1, 2022 totaled 2.11 million head, down 5 percent from January 1, 2021.
Calves under 500 pounds as of January 1, 2022 totaled 13.9 million head, down 3 percent from January 1, 2021.
Cattle and calves on feed for the slaughter market in the United States for all feedlots totaled 14.7 million head on January 1, 2022. The inventory is up slightly from the January 1, 2021 total of 14.7 million head. Cattle on feed in feedlots with capacity of 1,000 or more head accounted for 81.9 percent of the total cattle on feed on January 1, 2022, up slightly from the previous year. The combined total of calves under 500 pounds and other heifers and steers over 500 pounds (outside of feedlots) at 25.5 million head, was 3 percent below January 1, 2021.
The 2021 calf crop in the United States was estimated at 35.1 million head, down 1 percent from the previous year's calf crop. Calves born during the first half of 2021 were estimated at 25.6 million head, down 1 percent from the first half of 2020. Calves born during the second half of 2021 were estimated at 9.46 million head, 27 percent of the total 2021 calf crop.
2021 Exports
The United States hide, skin, and leather industry exported more than $1.4 billion in combined cattle hides, pigskins and semi-processed leather products in 2021, representing a $506 million increase compared to 2020.
According to U.S. Department of Agriculture data, U.S. exports of salted cattle hides exceeded $959 million in value, a 67 percent increase from 2020 levels. Exports of wet blue cattle hides rose 53 percent in value from 2020, totaling $451 million.
China was the largest buyer of salted cattle hides, with imports valued at more than $584 million. China also edged out Italy as the single largest destination for wet blue cattle hides, with imports valued at more than $131 million in 2021. Other large export markets included South Korea, Mexico, Thailand, and Vietnam.
U.S. pigskin exports increased 31 percent in value, surpassing $26 million for the year. Strong U.S. pigskin export growth to Mexico, Cambodia, and Thailand propelled this overall pigskin export value, and offset smaller losses to China, the third largest export destination. Together, Mexico and Thailand accounted for the vast majority of all U.S. pigskin exports, but export value to Cambodia increased exponentially, rising 1124%.
NOTE REGARDING VOLUME DATA: While the total quantity of hides and skins exported for 2021 are reported in the tables below, it should be noted that the Leather and Hide Council of America has requested the U.S. Department of Agriculture to review this data for accuracy. At this time the Association believes the quantity numbers reported in the data below are slightly inflated, especially when compared to other data sources from the agency. The LHCA will issue an update to this report when the results of the USDA review are finalized and any adjustments to volume numbers made.
Export Numbers for U.S. Bovine Fresh/Wet Salted Hides
Number of Pieces/Thousand $U.S.
|
|
Number of Pieces |
Value Thousand $ |
||||
|
|
Jan – Dec 2020 |
Jan – Dec 2021 |
% Chg |
Jan - Dec 2019 |
Jan – Dec 2021 |
% Chng |
|
World Total |
23,755,569 |
30,353,625 |
28% |
574,873 |
959,563 |
67% |
|
China/HK |
15,312,327 |
20,463,683 |
34% |
369,712 |
584,849 |
58% |
|
Korea |
1,847,962 |
2,948,686 |
60% |
63,650 |
124,054 |
95% |
|
Mexico |
4,525,032 |
3,867,295 |
-15% |
69,654 |
117,750 |
69% |
|
Thailand |
603,861 |
1,185,570 |
96% |
24,549 |
55,387 |
126% |
|
Brazil |
242,193 |
439,069 |
81% |
8,768 |
22,477 |
156% |
|
Taiwan |
259,009 |
451,707 |
74% |
8,076 |
18,390 |
128% |
|
Japan |
58,740 |
159,931 |
172% |
3,344 |
9,571 |
186% |
|
EU-27 |
312,455 |
232,885 |
-25% |
9,866 |
8,704 |
-12% |
|
Indonesia |
159,794 |
165,691 |
4% |
5,186 |
5,103 |
-2% |
|
(Only Italy) |
154,819 |
94,759 |
-39% |
3,569 |
3,673 |
3% |
|
Vietnam |
106,529 |
96,362 |
-10% |
3,143 |
3,202 |
2% |
|
Ethiopia |
15,511 |
55,927 |
261% |
414 |
2,691 |
550% |
|
Cambodia |
94,573 |
65,096 |
-31% |
2,395 |
2,017 |
-16% |
|
Israel |
59,529 |
112,830 |
90% |
1,122 |
1,823 |
62% |
|
Canada |
10,861 |
31,589 |
191% |
619 |
1,200 |
94% |
|
Turkey |
115,753 |
37,838 |
-67% |
3,329 |
951 |
-71% |
|
India |
12,629 |
18,764 |
49% |
308 |
828 |
169% |
|
UK |
4,021 |
1,768 |
-56% |
271 |
184 |
-32% |
|
Pakistan |
1,292 |
8,200 |
535% |
45 |
82 |
82% |
|
Chile |
0 |
1,118 |
- |
0 |
80 |
- |
|
Nigeria |
37 |
4,008 |
10732% |
5 |
71 |
1320% |
|
Togo |
40 |
2,002 |
4905% |
8 |
51 |
538% |
|
Egypt |
6,696 |
1,920 |
-71% |
184 |
38 |
-79% |
|
Bos. & Herz. |
1,777 |
1,120 |
-37% |
52 |
32 |
-38% |
|
Colombia |
234 |
23 |
-90% |
10 |
9 |
-10% |
|
Singapore |
0 |
443 |
- |
0 |
9 |
- |
|
Costa Rica |
0 |
100 |
- |
0 |
5 |
- |
|
-82% |
2,588 |
308 |
-88% |
|||
|
Egypt |
9,325 |
6,696 |
-28% |
222 |
184 |
-17% |
|
El Salvador |
0 |
763 |
- |
0 |
58 |
- |
|
Dom. Rep. |
1,530 |
550 |
-64% |
94 |
57 |
-39% |
|
Pakistan |
576 |
1,391 |
141% |
53 |
53 |
0% |
|
Bos. & Herz. |
11,334 |
1,777 |
-84% |
787 |
52 |
-93% |
|
Argentina |
0 |
540 |
- |
0 |
22 |
- |
|
Colombia |
7,015 |
234 |
-97% |
342 |
10 |
-97% |
|
Kuwait |
56 |
2,639 |
4613% |
4 |
10 |
150% |
|
Switzerland |
0 |
107 |
- |
0 |
9 |
- |
|
Togo |
0 |
40 |
- |
0 |
8 |
- |
|
Nigeria |
119 |
37 |
-69% |
21 |
5 |
-76% |
|
Saudi Arabia |
0 |
115 |
- |
0 |
3 |
- |
Export Numbers for U.S. Wet Blue Hides
|
Number of Pieces |
Value Thousand $ |
|||||
|
|
Jan – Dec 2020 |
Jan – Dec 2021 |
% Chg |
Jan - Dec |
Jan - Dec 2020 |
% Chng |
|
World Total |
2,910,305 |
4,448,837 |
53% |
294,888 |
451,296 |
53% |
|
China/HK |
792,991 |
1,222,973 |
54% |
78,087 |
131,241 |
68% |
|
EU-27 |
807,704 |
1,318,183 |
63% |
88,636 |
131,094 |
48% |
|
(Only Italy) |
807,704 |
1,312,533 |
63% |
88,636 |
130,546 |
47% |
|
Vietnam |
637,831 |
1,100,391 |
73% |
66,806 |
115,992 |
74% |
|
Mexico |
195,085 |
370,408 |
90% |
20,910 |
25,766 |
23% |
|
Thailand |
208,297 |
162,598 |
-22% |
22,889 |
18,898 |
-17% |
|
Brazil |
115,292 |
88,482 |
-23% |
5,166 |
10,092 |
95% |
|
Taiwan |
68,524 |
68,242 |
0% |
4,378 |
5,991 |
37% |
|
Dom. Rep. |
13,391 |
46,763 |
249% |
1,557 |
5,100 |
228% |
|
Korea |
27,496 |
27,079 |
-2% |
3,196 |
3,091 |
-3% |
|
Japan |
5,989 |
18,114 |
202% |
696 |
1,931 |
177% |
|
India |
22,773 |
17,038 |
-25% |
2,046 |
1,673 |
-18% |
|
Leeward-Windward Islands |
14,526 |
7,084 |
-51% |
471 |
255 |
-46% |
|
Turkey |
0 |
823 |
- |
0 |
96 |
- |
|
Chile |
0 |
487 |
- |
0 |
57 |
- |
|
Argentina |
0 |
172 |
- |
0 |
20 |
- |
Export Numbers for U.S. Pig Skins
|
|
Number of Pieces |
Value Thousand $ |
||||
|
|
Jan – Dec 2020 |
Jan - Dec 2020 |
% Chg |
Jan – Dec 2020 |
Jan – Dec 2021 |
% Chng |
|
World Total |
2,020,541 |
2,401,736 |
19% |
20,031 |
26,262 |
31% |
|
Mexico |
411,024 |
744,678 |
81% |
3,418 |
7,926 |
132% |
|
Thailand |
342,848 |
535,135 |
56% |
4,951 |
7,346 |
48% |
|
China/HK |
912,217 |
261,745 |
-71% |
7,812 |
3,545 |
-55% |
|
Cambodia |
28,973 |
317,874 |
997% |
220 |
2,692 |
1124% |
|
Taiwan |
129,709 |
237,438 |
83% |
1,357 |
2,050 |
51% |
|
Vietnam |
88,462 |
233,538 |
164% |
915 |
1,765 |
93% |
|
UK |
104,000 |
63,500 |
-39% |
1,298 |
823 |
-37% |
|
Japan |
756 |
6,345 |
739% |
23 |
100 |
335% |
|
Korea |
522 |
990 |
90% |
8 |
10 |
25% |
|
Canada |
0 |
493 |
- |
0 |
5 |
- |
2022 Outlook
The U.S. cattle herd is expected to contract in 2022, ending a period of expansion that began in 2014, according to the latest data available from the U.S. Department of Agriculture. This can be seen in the higher number of female cattle (cows and heifers) in the slaughter ratios toward the end of 2021, signaling a reduction in the breeding herd. Though herd growth will likely contract, slaughter levels are expected to slow by two percent in 2022, yielding an adequate supply of hides to the market.
More important in the eyes of many U.S. hides and skins suppliers, though, is the global leather demand situation, and the rise of synthetic products as alternatives to leather. The leather industry market experienced significant competition from these alternatives for the last several years globally, which has been strained further by COVID-related supply change challenges and labor shortages.
Despite these challenges, the U.S. industry is poised to once again contend with changing global demand, price fluctuations, and disinformation campaigns that seek to intentionally mischaracterize leather’s sustainability credentials and environmental impact. Petroleum-based plastic synthetics and “plant-based” alternatives, that incorporate a mix of plant and plastic combinations, that imitate leather have taken significant market share away from the material in consumer product areas such as footwear and automobile upholstery. The situation was so dire in the past two years that millions of lower quality U.S. hides and skins were discarded and destroyed rather than processed into leather – a trend that has continued as market incentives to process and distribute certain hides have diminished.
The industry, however, has intensified efforts to combat the proliferation of falsehoods about leather. One such effort, “Real Leather. Stay Different.,” celebrates the versatility, beauty, sustainability, and durability of U.S. leather, and simultaneously encourages the use and purchase of real leather over synthetics by engaging brands, retailers, and consumers. The campaign, which is now entering its third year, unveiled regional and country-specific student design competitions in 2020, that paved the way for a successful international competition in 2021, with more than 2,000 design entries from nearly 40 countries. The 2022 International Student Design Competition is projected to exceed 2021 participation. The contest aims to position leather as the material of choice among the next generation of designers and to equip them with the knowledge and confidence to incorporate real leather in future designs.
These aforementioned initiatives complement a robust social media presence and increasing collaboration among the global leather industry to take a more proactive role in shaping leather’s story. In 2022, the U.S. industry will remain committed, in partnership with other leather industry associations, to ensuring leather’s sustainability is recognized in international fora. Myths concerning leather’s environmental impact have erroneously caused some designers, manufacturers, and retailers to source synthetic and other materials that often speciously boast a lower carbon footprint, when in fact, this ‘greenwashing’ only hastens environmental degradation. Dispelling these inaccuracies is an essential prerequisite to rebuilding global demand for leather in the years ahead. To that end, the U.S. industry will embark on a leather life cycle assessment in 2022 to provide additional quantitative support to refute unfounded claims and old, out-of-date “zombie data” that question leather’s sustainability.
The ongoing pressure on global supply chains, and its implications for leather trade particularly to parts of Asia and Europe, however, could produce unstable price fluctuations and hamper market access to key leather-producing countries. While worker absenteeism was a major concern in 2021, stemming from uneven vaccine distribution and the emergence of new COVID variants, the industry has become increasingly concerned about transportation logistics issues and supply chain disruptions. Ocean carriers and marine terminal operators in the U.S. continue to shirk guidance and levy unreasonable costs on agricultural shippers, who are grappling with exorbitant charges and are unable to obtain empty containers to export products to key foreign markets, including China. This trend accelerated in 2021 and has persisted in the first few months of 2022, with no immediate end in sight. As an export-driven industry, U.S. hides, skin and leather exports have not been spared from the consequences of these nefarious practices, as ocean carriers have elected to hasten empty containers back to Asia to fill with finished consumer goods instead of carrying cargo, like U.S. hides and skins, to their global customers. These actions not only undermine the perception of the U.S. as a reliable raw materials supplier to the global leather industry, but they also risk allowing the industry’s competitors to capture market share that has been ceded by the U.S.’s absence. The U.S. hide, skin and leather industry has been, and will continue to be, engaged in cross-sector advocacy with the U.S. Administration, Congress, and other stakeholders to ensure a prompt resolution to this issue.
Assessing the situation in 2022 would be incomplete without considering the U.S. political landscape. As we reported last year, President Joe Biden has focused mostly on domestic issues, including reviving the U.S. economy and providing COVID-19 relief, while largely deemphasizing trade. The Administration spent the majority of its first year in office reviewing former President Trump’s trade policies, and, for the most part, preserved many of the tariffs that his predecessor implemented. Although the Administration’s trade team remains incomplete – the President’s nominee for Chief Agriculture Negotiator in the Office of the U.S. Trade Representative has not yet received Senate confirmation, for example – the Administration’s trade chief, Ambassador Katherine Tai, has underscored the President’s preference for narrower trade cooperation, as opposed to negotiating comprehensive free trade agreements. This approach is not expected to meaningfully improve access for U.S. goods in critical export markets, potentially disadvantaging U.S. hides, skin, and leather products in the crucial, and growing, ASEAN region, where the European Union, China, and other countries are exerting greater influence.
In sum, the year ahead will be busy for LHCA, as it continues to advocate on behalf of the U.S. hide, skin, and leather industry in both domestic and global settings. Part of this work includes preserving and expanding, where possible, the industry’s access to export markets, while defending leather against policies that seek to constrain its production or sale within the U.S. This advocacy will complement ongoing marketing, promotion, and consumer, brand, and retailer education initiatives aimed at revitalizing leather production and consumption both in the U.S. and abroad.
About LHCA
The Leather and Hide Council of America (LHCA) is a full-service industry trade association representing the entire U.S. leather supply chain, including meatpackers, hides and skins processors, traders, leather tanners, finished leather goods producers, footwear companies, chemical suppliers, and more. The association provides its members with government, public relations, and international trade assistance and support. LHCA is a cooperator organization under the U.S. Department of Agriculture’s foreign market development programs, assisting U.S. firms develop new markets for U.S. agricultural exports. LHCA is at the forefront of the industry’s needs, providing members with education and technical information to compete in today’s global marketplace.